For a chronological interpretation of the concurrent FCM development, please see here.
Regarding the interpretation:
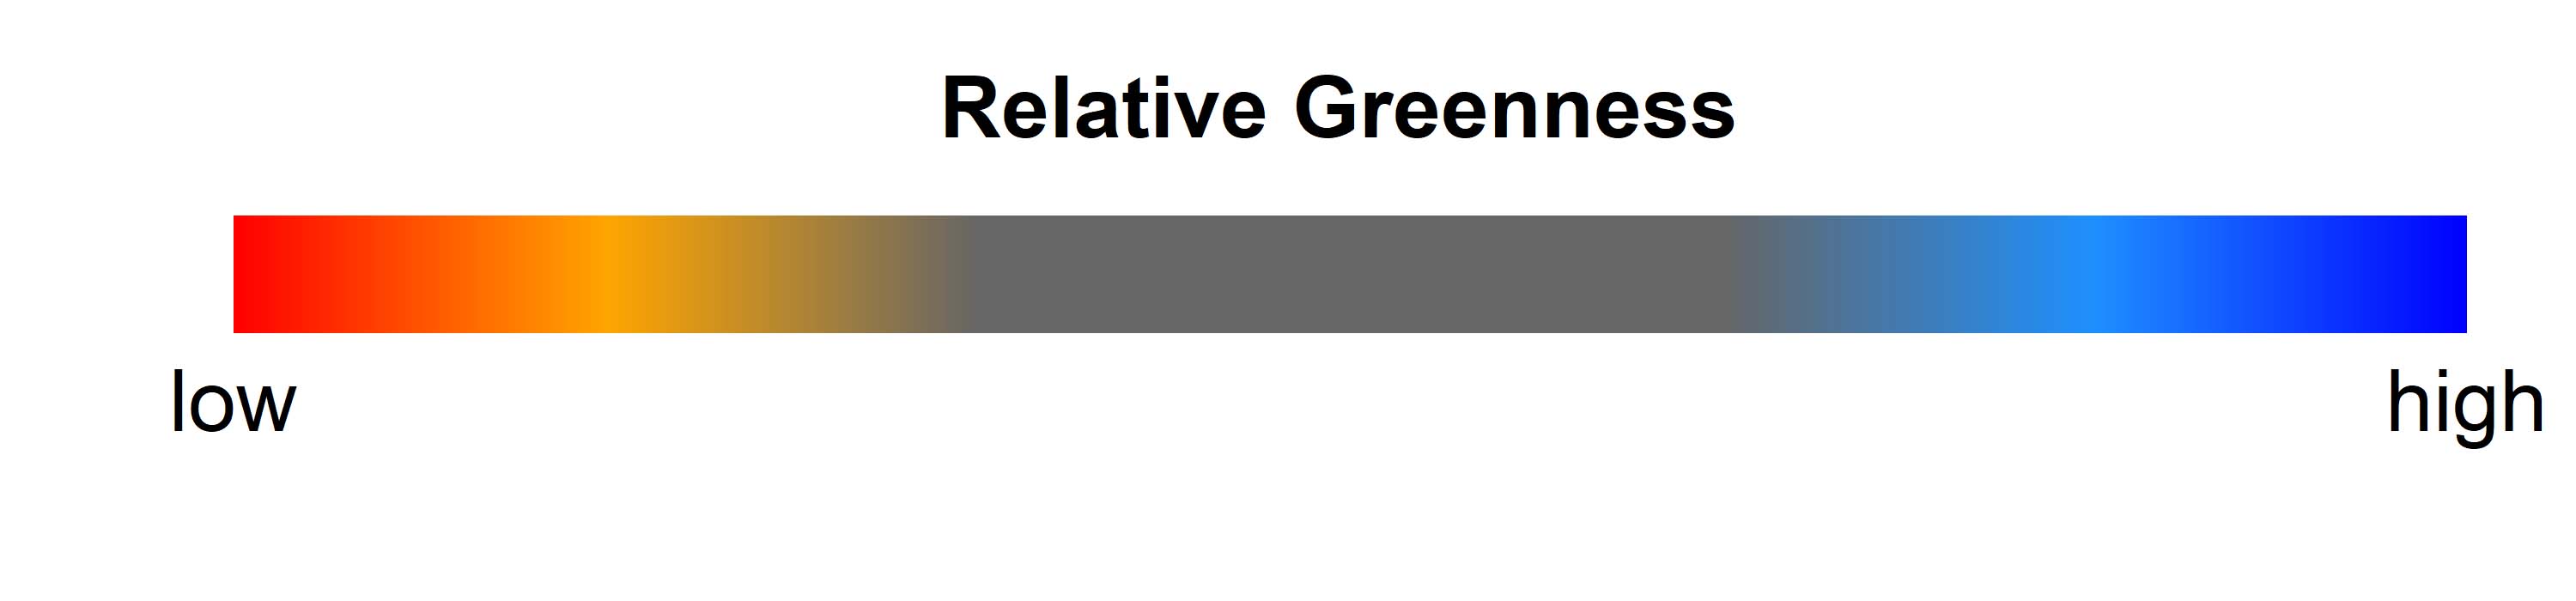
The quantiles allow for a relative classification of the observed greenness values in a long-term comparison. Thereby, extreme values become visible if, e.g. due to weather conditions (early spring, late frost, drought), highest or lowest greenness values are measured over the observation period (2003-today). A good example of this can be seen in spring 2018, where highest greenness values (shown in blue to dark blue colours) were observed in many parts of Germany during May. However, from June 2018 onwards, more and more forest areas came under the influence of the extreme drought situation (reference 7), which resulted in a successive change towards lowest greenness values (red to dark red), which sometimes reflects the premature leaf discoloration observed in many places, but also the death of individual trees.
At sites where trees died after the droughts of 2015 and 2018, very low and lowest quantiles were observed immediately during tree death. However, this does not permit the reverse conclusion that trees are dying at all sites with low quantiles, since even slight deviations in greenness (which do not necessarily indicate stress) can lead to extreme values on areas with an overall low variability. For this reason, quantiles should always be interpreted in relation to proportions.
The quantiles of former drought-years are to be found in the archive.
This website uses cookies to improve your experience. We'll assume you're ok with this, but you can opt-out if you wish. Cookie settingsACCEPT
Privacy & Cookies Policy
Privacy Overview
This website uses cookies to improve your experience while you navigate through the website. Out of these cookies, the cookies that are categorized as necessary are stored on your browser as they are essential for the working of basic functionalities of the website. We also use third-party cookies that help us analyze and understand how you use this website. These cookies will be stored in your browser only with your consent. You also have the option to opt-out of these cookies. But opting out of some of these cookies may have an effect on your browsing experience.
Necessary cookies are absolutely essential for the website to function properly. This category only includes cookies that ensures basic functionalities and security features of the website. These cookies do not store any personal information.
Any cookies that may not be particularly necessary for the website to function and is used specifically to collect user personal data via analytics, ads, other embedded contents are termed as non-necessary cookies. It is mandatory to procure user consent prior to running these cookies on your website.