For a chronological interpretation of the concurrent FCM development, please see here.
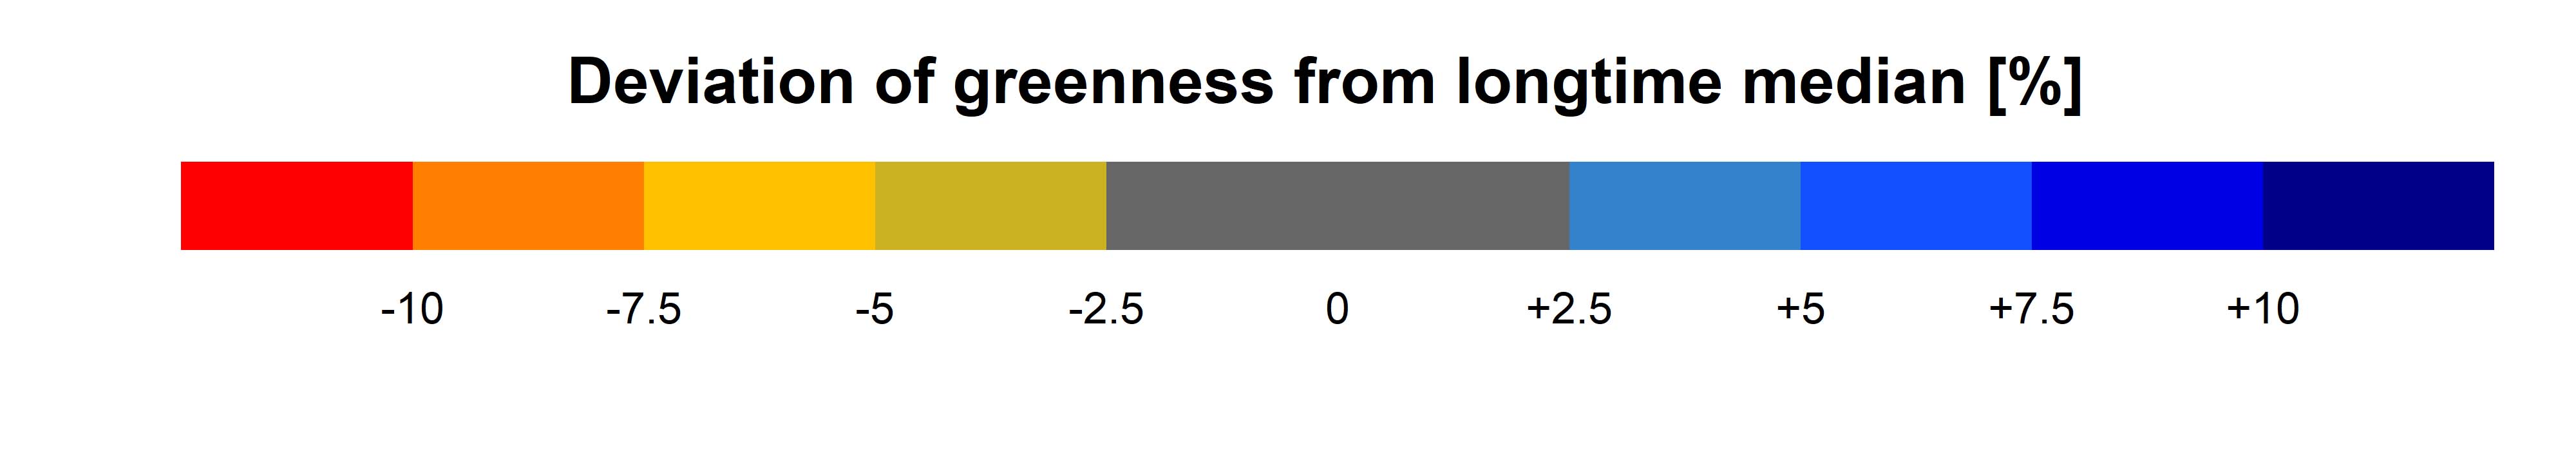
Regarding the interpretation: The proportions allow a quasi-absolute quantification of the observed greenness values in a long-term comparison. To do so, the absolute deviations from the long-term mean (more precisely, the median) are computed. Quantiles -which do not allow for quantifying the absolute deviations – should always be interpreted in connection with the proportions to get an idea of the absolute greenness deviations.
In order to enable a classification of the values, proportions were quantified for locations at which dying pines have been observed in spring 2016 as a result of the 2015 summer drought (references 2-3) as well as dying beech trees in spring 2019 (reference 7) as a consequence of the 2018 summer drought (reference 7). Proportions observed at these locations varied between -20 and -5 % at the time of tree death and averaged -10 %. In addition, theoretical considerations were made based on high-resolution, multispectral drone flights of dying pines (reference 2), according to which a greenness value of -10 % would indicate that at least a quarter of the population is under severe stress. A transfer of this interpretation, based on observations and theoretical considerations, to other sites seems plausible, but should be done with caution as due to the relatively coarse spatial resolution of the satellite images other subscale processes can influence the computed greenness values.
The proportions of former drought-years are to be found in the archive.
This website uses cookies to improve your experience. We'll assume you're ok with this, but you can opt-out if you wish. Cookie settingsACCEPT
Privacy & Cookies Policy
Privacy Overview
This website uses cookies to improve your experience while you navigate through the website. Out of these cookies, the cookies that are categorized as necessary are stored on your browser as they are essential for the working of basic functionalities of the website. We also use third-party cookies that help us analyze and understand how you use this website. These cookies will be stored in your browser only with your consent. You also have the option to opt-out of these cookies. But opting out of some of these cookies may have an effect on your browsing experience.
Necessary cookies are absolutely essential for the website to function properly. This category only includes cookies that ensures basic functionalities and security features of the website. These cookies do not store any personal information.
Any cookies that may not be particularly necessary for the website to function and is used specifically to collect user personal data via analytics, ads, other embedded contents are termed as non-necessary cookies. It is mandatory to procure user consent prior to running these cookies on your website.